
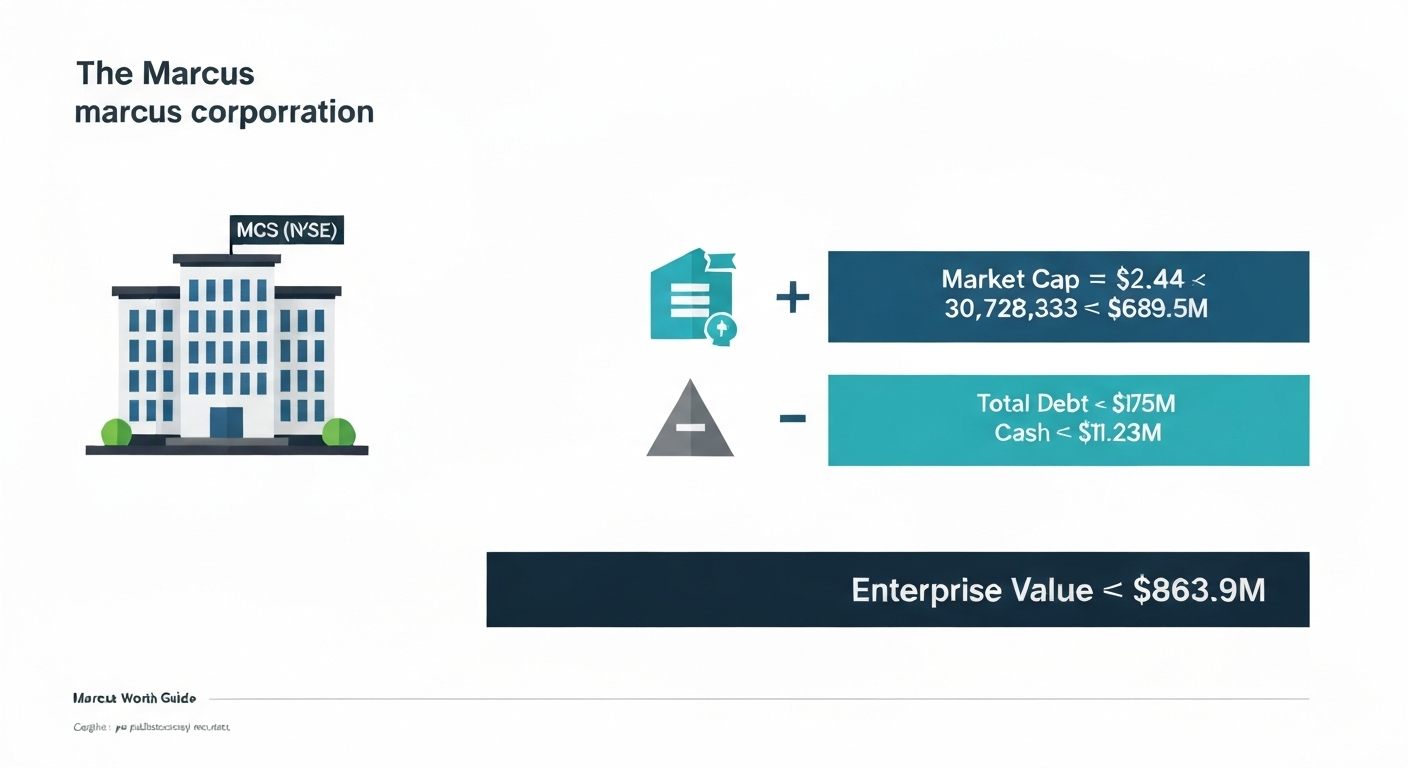
When people search 'Marcus Corporation net worth,' they are almost always asking about the financial value of The Marcus Corporation (NYSE: MCS), a publicly traded hospitality and entertainment company, not a single person's wealth. For a company, 'net worth' typically means either market capitalization (share price multiplied by total shares outstanding) or enterprise value (market cap adjusted for debt and cash). Using a delayed share price near $22.44 and the 30,728,333 total shares outstanding reported in the company's most recent 10-Q (as of April 27, 2026), the implied market capitalization sits around $689.5 million. Enterprise value will be meaningfully higher once you add the company's roughly $175 million in total debt and subtract its cash. Those numbers move every trading day, so any published figure needs a clear timestamp and source.
Marcus Corporation Net Worth: Valuation Guide & Editor Checklist

Corporate 'net worth' vs. a person's net worth
When we profile individuals on this site, net worth means the estimated total assets a person owns minus what they owe: a straightforward personal balance sheet. A public company's equivalent is more nuanced and comes in two standard flavors that analysts use for different purposes.
- Market capitalization: the total dollar value of all outstanding shares. It answers the question 'what would it cost to buy every share on the open market today?' It says nothing about the company's debt load.
- Enterprise value (EV): market cap adjusted for the company's capital structure. It adds outstanding debt (because an acquirer inherits it) and subtracts cash (because an acquirer keeps it). EV is the number dealmakers use when valuing a takeover.
- Book value / shareholders' equity: the accounting residual (total assets minus total liabilities) reported on the balance sheet. This is the closest accounting analogue to a personal 'net worth,' but market prices and book values diverge significantly for most public companies.
For casual readers, the simplest translation is: market cap tells you what the stock market says the equity is worth right now; enterprise value tells you what the whole business would cost to acquire (debt and all). Neither figure is the same as what a founder or executive personally holds, which is a function of how many shares they own plus any other personal assets.
The exact formulas you need
These are the two formulas any editor or curious reader should keep at hand when calculating The Marcus Corporation's current value.
Market capitalization
Market Cap = Share Price × Total Issued and Outstanding Shares. For Marcus, 'total shares outstanding' means common stock plus Class B common stock, because both classes are publicly disclosed. Do not use the diluted weighted-average share count that appears in the earnings-per-share table; that is a time-weighted average used only for EPS arithmetic, not a point-in-time headcount of shares.
Enterprise value
The standard formula is: EV = Market Capitalization + Total Debt + Preferred Stock + Minority Interests - Cash and Cash Equivalents. Analysts sometimes add finance lease liabilities and unfunded pension obligations depending on context; Marcus's own filings include finance lease obligations in their net-debt reconciliation, so that is a reasonable adjustment to make. As of the March 31, 2026 10-Q, Marcus reports no preferred stock issued and no material noncontrolling interests, so those two terms drop to zero in the calculation.
Step-by-step: calculating Marcus Corporation's current value
Because share price changes every trading session, no static article can give you a permanently correct number. What it can give you is a repeatable workflow. Here are the exact data points you need, where each one lives, and the arithmetic that ties them together.
- Fetch the current share price for ticker MCS on the NYSE. Record the price, the exact timestamp of the quote, and whether it is real-time or delayed (at minimum 20 minutes delayed on most free sources).
- Confirm total shares outstanding: common stock outstanding plus Class B common stock outstanding, as disclosed in the latest 10-Q or 10-K cover page. Per the April 30, 2026 filing (period ending March 31, 2026), those figures were 23,743,749 common shares and 6,984,584 Class B shares, totaling 30,728,333.
- Calculate market capitalization: multiply the price from Step 1 by the share total from Step 2. Using the illustrative IR-page quote of $22.44 × 30,728,333 shares gives approximately $689,543,793.
- Pull total debt from the Long-Term Debt note in the most recent 10-Q. The March 31, 2026 balance sheet shows senior notes of $150,000,000 and a revolving credit agreement balance of $25,000,000, giving total debt of $175,000,000. Note that the balance-sheet line 'Long-term debt' ($174,062,000) is net of issuance costs; use the gross figure from the debt note for EV purposes.
- Add finance lease obligations if including them: the company's own net-debt reconciliation in the March 31, 2026 10-Q carries finance lease obligations of $10,600,000.
- Pull cash from the consolidated balance sheet: cash and cash equivalents of $11,229,000 and restricted cash of $3,125,000 as of March 31, 2026. Decide whether to subtract both or only unrestricted cash; note your choice.
- Confirm preferred stock (none issued as of the filing) and noncontrolling interests (none material per the balance sheet). Both terms are zero for Marcus at this reporting date.
- Calculate enterprise value using your chosen variation. Example: EV = Market Cap + $175,000,000 (total debt) + $10,600,000 (finance leases) + $0 (preferred) + $0 (minority) - $11,229,000 (unrestricted cash). With the illustrative ~$689.5M market cap, that gives an EV of approximately $863.9 million before any pension or joint-venture adjustments.
- Record all source URLs, filing accession numbers, quote timestamps, and the exact balance-sheet line names used. This metadata is what makes the figure verifiable and updatable.
Where to find every data point
Knowing the formula is half the job. Knowing exactly where to pull each input is the other half. Here is the authoritative source for each variable.
Ticker symbol and SEC identity
The Marcus Corporation trades on the NYSE under the ticker MCS. Its SEC Central Index Key (CIK) is 0000062234. You can confirm both by searching 'Marcus Corp' on SEC EDGAR (sec.gov/cgi-bin/browse-edgar) and verifying the entity name matches before pulling any filing.
SEC filings to use
The primary documents for balance-sheet data are the Form 10-Q (filed quarterly, covers three-, six-, and nine-month periods) and the Form 10-K (filed annually, covers the full fiscal year). The most recent 10-Q as of this writing covers the quarter ended March 31, 2026, filed April 30, 2026, with SEC accession number 0000062234-26-000028. Always pull the full filing, not just the press release, because the detailed notes to the financial statements contain the debt breakdown and lease schedules that the summary tables omit.
Where to pull live price and shares outstanding
For a timestamped real-time or near-real-time price, use a professional market data feed: IEX Cloud, Bloomberg Terminal, Reuters Eikon, or the Nasdaq and NYSE real-time data APIs all provide ISO 8601-timestamped quotes. For a quick sanity check, Google Finance and the company's own investor-relations stock quote page (which shows an MCS quote widget) work fine, but both carry at least a 20-minute delay; label any figure drawn from them accordingly. Shares outstanding should always come directly from the most recent 10-Q or 10-K cover page, not from a third-party data aggregator, because aggregators sometimes carry stale or incorrectly combined class counts.
Finding cash and debt on EDGAR
In any Marcus 10-Q or 10-K, navigate to the Consolidated Balance Sheets for 'Cash and cash equivalents' and 'Restricted cash.' For debt, go to the Notes to Consolidated Financial Statements and find Note 2 'Long-Term Debt,' which itemizes senior notes, the revolving credit agreement, current portions, and issuance-cost offsets. Finance lease obligations appear both in the Leases note (Note 3 in the March 2026 filing) and in the company's own Net Debt reconciliation table, which Marcus includes as a non-GAAP disclosure. That reconciliation is useful as a cross-check because it shows exactly how management nets debt against cash for leverage purposes. See The Marcus Corporation Form 10‑Q, Notes to Consolidated Financial Statements (Leases, Long‑Term Debt, pensions, investments in joint ventures) for the lease schedules, long‑term debt details, pension disclosures, and investments in joint ventures The Marcus Corporation Form 10‑Q — Notes to Consolidated Financial Statements (Leases, Long‑Term Debt, pensions, investments in joint ventures).
Reusable publication table template
Use the table below as a template when publishing or updating a Marcus Corporation valuation profile. Fill in each cell from the sources described above, and always include the metadata rows at the bottom so readers and editors know exactly when the numbers were valid.
| Data Point | Value (fill in) | Source Document / URL | Line Item Name | As-of Date / Timestamp |
|---|---|---|---|---|
| Ticker / Exchange | MCS / NYSE | Marcus IR or SEC EDGAR header | Ticker symbol | Confirm each filing |
| Share price | [Enter price] | IEX / Bloomberg / NYSE feed | Last sale price | [Timestamp with timezone] |
| Common shares outstanding | [Enter count] | Form 10-Q or 10-K cover | Common stock outstanding at [date] | [Date on filing cover] |
| Class B shares outstanding | [Enter count] | Form 10-Q or 10-K cover | Class B common stock outstanding at [date] | [Date on filing cover] |
| Total shares outstanding | [Sum of above] | Calculated from 10-Q/10-K | Common + Class B | [Same date as above] |
| Market capitalization | [Price × Total shares] | Calculated | Price × point-in-time shares | [Quote timestamp] |
| Senior notes (gross) | [Enter amount] | Form 10-Q Note 2 Long-Term Debt | Senior notes | [Period end date] |
| Revolving credit balance | [Enter amount] | Form 10-Q Note 2 Long-Term Debt | Revolving credit agreement | [Period end date] |
| Total debt (gross) | [Sum of debt lines] | Form 10-Q Note 2 | Total debt | [Period end date] |
| Finance lease obligations | [Enter amount] | Form 10-Q Leases note / Net Debt recon | Finance lease obligations | [Period end date] |
| Cash and cash equivalents | [Enter amount] | Form 10-Q Consolidated Balance Sheets | Cash and cash equivalents | [Period end date] |
| Restricted cash | [Enter amount] | Form 10-Q Consolidated Balance Sheets | Restricted cash | [Period end date] |
| Preferred stock outstanding | None issued | Form 10-Q Consolidated Balance Sheets | Preferred Stock | [Period end date] |
| Noncontrolling interests | None material | Form 10-Q Shareholders' Equity | Noncontrolling interest | [Period end date] |
| Enterprise value (calculated) | [EV formula result] | Calculated from above inputs | See EV formula and variation used | [Quote + filing timestamp] |
| SEC accession number | [Enter number] | SEC EDGAR filing index | Accession number | [Filing date and time] |
Every published table should include a visible caption stating the formula variation used (for example, whether operating leases were added) and a disclosure that all figures reflect a specific date and time and may have changed. If the article lives on a page that is periodically updated, add a 'Last reviewed' line at the top of the table as well.
Image suggestions for this topic
- Stock chart screenshot (MCS, NYSE): Caption — 'The Marcus Corporation (MCS) share price chart as of [date]. Data: [source name].' Alt text: 'Line chart showing MCS stock price movement on the NYSE.'
- Marcus Corporation hotel or cinema exterior (licensed or official press image): Caption — 'The Marcus Corporation operates hotel and entertainment properties across the United States.' Alt text: 'Exterior of a Marcus Hotels and Resorts property.'
- Enterprise value formula diagram (original graphic): Caption — 'How enterprise value is calculated for a public company like The Marcus Corporation.' Alt text: 'Diagram showing the enterprise value formula: market cap plus debt plus preferred plus minority interest minus cash.'
- SEC EDGAR filing index screenshot: Caption — 'The Marcus Corporation Form 10-Q filing index on SEC EDGAR (accession number 0000062234-26-000028, filed April 30, 2026).' Alt text: 'Screenshot of SEC EDGAR filing index page for Marcus Corporation Form 10-Q.'
Notes for sibling personal-name queries
Several closely related searches on this site involve real individuals rather than a publicly traded corporation. For individual profiles and personal estimates, see our Marcus net worth page. Each requires a completely different research approach, and each profile must clearly establish which specific person is being profiled before any wealth figure is published.
Marcus Banks
Searches for Marcus Banks typically refer to the former NBA player who competed in the league from 2003 to 2009. His profile (covered separately on this site) is a personal net worth page, not a corporate valuation. The primary sources are career salary databases (Basketball Reference, Spotrac, and HoopsHype carry reliable historical contract data), not SEC filings. There is no publicly traded company tied to this name in the same way MCS is tied to The Marcus Corporation. Confirm the subject's full name, birth year, and career timeline before publishing any figure to avoid confusion with other individuals named Marcus Banks.
Marcus Adoro
Marcus Adoro is the guitarist for the Filipino rock band Eraserheads. His estimated net worth is drawn from music industry earnings: record sales, touring revenue, royalties, and any solo or reunion project income. Sources include Philippine music industry publications, verified social media disclosures, and licensed music earnings trackers. This profile (also covered separately here) requires geographic and industry context that differs significantly from both the corporate valuation above and NBA salary profiles.
Marcus East
Marcus East is a technology executive known for roles at companies including National Geographic and PepsiCo. A net worth profile for him draws on executive compensation disclosures (proxy statements filed with the SEC if the employer is public), reported equity grants, and career trajectory context from LinkedIn and verified press interviews. If his current employer is publicly traded, the employer's proxy statement (DEF 14A) is the best source for salary, bonus, and equity award figures. The separate profile for Marcus East on this site covers those sourcing steps in detail.
Marcus from The Profit
'Marcus from The Profit' refers to Marcus Lemonis, the CNBC television personality, entrepreneur, and former CEO of Camping World Holdings (CWH). His profile is the most complex of the group because it blends public executive compensation (disclosed in CWH proxy filings), reported equity ownership in the publicly traded company, and private investment activity across the small businesses he has funded through the show. For any net worth estimate, the CWH proxy statement, 13D/13G beneficial ownership filings on EDGAR, and CWH annual reports are the required primary sources. The dedicated profile for Marcus from The Profit on this site walks through that sourcing workflow.
Key distinction for all personal-name pages
None of the four individuals above are executives or significant shareholders of The Marcus Corporation (MCS), so their pages should carry no cross-reference to the company's stock price or SEC filings. The only overlap worth noting is methodological: whenever a profiled individual holds equity in a public company, the same market-cap and share-price methodology described above applies to valuing that equity stake.
Citation and update checklist for editors
Every numeric claim in a Marcus Corporation valuation article must be traceable to a specific document, line item, and timestamp. The checklist below covers what to cite, how to timestamp it, how often to update, and how to version changes.
What to cite for each claim
- Share price: cite the data provider (IEX, Bloomberg, Google Finance, or the Marcus IR page), the exact price displayed, and the ISO 8601 timestamp including timezone (for example: $22.44, Google Finance, 2026-07-16T14:32:00-04:00).
- Shares outstanding: cite the specific 10-Q or 10-K filing by accession number, the period of report, the filing date, and the exact line text (for example: 'Common stock outstanding at April 27, 2026: 23,743,749 — The Marcus Corporation Form 10-Q, accession 0000062234-26-000028, filed 2026-04-30').
- Debt figures: cite the Notes to Consolidated Financial Statements, the specific note number and name (Note 2 Long-Term Debt), the filing accession number, and the period of report. Distinguish between gross debt and debt net of issuance costs.
- Cash figures: cite the Consolidated Balance Sheets section, the line items by name ('Cash and cash equivalents,' 'Restricted cash'), the filing accession number, and the period-end date.
- Finance lease obligations: cite the Leases note number and the Net Debt reconciliation table by section heading within the same 10-Q filing.
- Enterprise value calculation: record the exact formula variant used, every input value, its source citation, and the timestamp. A brief methodology note visible to readers is good practice.
- Any non-GAAP measure (including the company's own Net Debt figure): label it explicitly as non-GAAP and cite the reconciliation table in the filing where the company defines it.
How to timestamp snapshots
Save a local screenshot or web archive (archive.org or archive.ph) of every source page at the time of publication. Name files using the convention [source]-[YYYY-MM-DD]-[HH-MM-TZ].png. For SEC filings, the EDGAR accession number and filing-accepted timestamp (shown in the filing index as 'Date Filed' and in the header as the accepted datetime) together constitute a permanent, immutable citation that does not require archiving.
Recommended update cadence
- Balance-sheet data (debt, cash, shares outstanding): update within two weeks of each 10-Q or 10-K filing. Marcus files 10-Qs in approximately May, August, and November; the 10-K arrives in late February or early March.
- Share price and market cap: treat as live data; note in the article that the figure reflects the date last reviewed. Do not present a historical price as current.
- Enterprise value: recalculate after each new quarterly filing AND after any material debt event (new bond issuance, credit facility draw, repayment) disclosed via Form 8-K.
- Sibling personal-name pages: update whenever a new employer proxy, contract announcement, or credible reported salary figure surfaces.
Versioning notes
Keep a revision log at the bottom of each article or in the CMS metadata: record the previous figure, the new figure, the reason for the change, and the date of the update. This practice treats corrections as a credibility signal rather than an embarrassment. If a prior estimate was based on incomplete data, say so plainly in the revision note.
Legal and accuracy reminders
Publishing financial figures about public companies and real individuals carries a few consistent obligations that every editor on this site should keep in mind.
Privacy and defamation
For personal-name net worth pages (Marcus Banks, Marcus Adoro, Marcus East, Marcus from The Profit), only publish information that is either self-disclosed by the subject, drawn from public filings, or reported by credible media outlets that have their own sourcing. Inferring personal net worth from salary records alone without accounting for taxes, known expenses, or asset structure produces estimates that must be labeled as estimates with wide uncertainty ranges. Avoid characterizing a person's wealth in language that implies confirmed fact when the basis is an educated calculation.
Rounding and disclosure language
All calculated figures should be rounded to no more precision than the inputs support. A market cap derived from a 20-minute-delayed price is accurate to the nearest few percent at best; presenting it to the nearest dollar is false precision. Round to the nearest million for market cap and EV figures, and label every rounded figure as approximate. For shares outstanding drawn directly from a 10-Q, the exact figure is fine to use since it comes from a signed legal document.
Suggested disclaimer
Include a disclosure block like the following on every company valuation page and personal net worth page: 'All figures on this page are estimates based on publicly available information and are provided for informational purposes only. Market capitalization and enterprise value reflect conditions at the date and time noted and will differ from current values. This content does not constitute financial advice, investment advice, or a solicitation to buy or sell securities. Readers should verify all figures independently before making any financial decision. Marcus Worth Guide has no affiliation with The Marcus Corporation or any individual profiled on this site.'
FAQ
Quick answer: What do readers mean by “Marcus Corporation net worth” and how is that different from a person’s net worth?
Plainly: for a publicly traded company like The Marcus Corporation (NYSE: MCS), “net worth” in financial reporting usually refers to corporate value measures — market capitalization (equity value) or enterprise value (EV) — not a private individual’s personal net worth. Market capitalization = market price × shares outstanding (point‑in‑time equity value). Enterprise value adjusts market cap for debt, lease obligations, cash and other items to reflect the value of the whole business to all claimholders. Personal‑name queries (e.g., "Marcus Banks" or "Marcus from The Profit") are separate: those ask for an individual’s net worth (assets minus liabilities) and require different sources (taxed public disclosures, interviews, business ownership stakes, or verified reporting).
Step‑by‑step: How to compute Marcus Corporation market capitalization (exact fields and formula)?
Fields to capture and formula: 1) Latest share price (source, timestamp, delay note). 2) Point‑in‑time shares outstanding (use company‑disclosed issued & outstanding common + Class B shares from the latest 10‑Q/10‑K or IR page). Formula: Market capitalization = Share price × Shares outstanding (point‑in‑time). Example (from sources): Price (20‑minute delayed Marcus IR quote) = $22.44; Shares outstanding (Apr 27, 2026, per 10‑Q) = 30,728,333 (common 23,743,749 + Class B 6,984,584) → Market cap ≈ $22.44 × 30,728,333 = $689,543,793. Record: price source/URL, price timestamp, share count source/line and date, and calculation timestamp.
Step‑by‑step: How to compute Marcus Corporation enterprise value (EV) and which filing lines to use?
Canonical formula (record any chosen variations): EV = Market capitalization + Total debt + Preferred stock + Minority interest + Capitalized lease liabilities − Cash & cash equivalents. For Marcus (map to 10‑Q lines): - Market capitalization: computed as above. - Total debt: Long‑term debt / Senior notes + Revolver (10‑Q Note 2) → $175,000,000 (reported; debt net of issuance costs $174,062,000). - Finance lease obligations (capitalized leases): use 'Finance lease obligations' from lease note / Net‑Debt reconciliation → $10,600,000. - Operating lease ROU liabilities: optional depending on practice (Marcus reports operating lease liabilities $148,894,000; include if your editorial policy treats operating leases as debt-equivalent). - Cash & cash equivalents: consolidated balance sheet → $11,229,000. - Restricted cash: decide editorial policy (Marcus reports $3,125,000); document chosen treatment. Worked EV example using company’s Net‑Debt reconciliation approach (company uses finance leases, subtracts cash): EV ≈ Market cap + Total debt + Finance lease obligations − Cash = $689,543,793 + $175,000,000 + $10,600,000 − $11,229,000 ≈ $863,914,793. Always cite each numeric cell (EDGAR URL, table name and line, and market quote URL/timestamp).
Which exact EDGAR filing lines and IR pages should editors capture for future updates?
Minimum fields and exact mapping to Marcus 10‑Q (Mar 31, 2026): - Ticker & exchange: NYSE: MCS (company IR header). - Shares outstanding (point in time): 'Common stock outstanding at Apr 27, 2026' and 'Class B common stock outstanding at Apr 27, 2026' (Consolidated Financial Statements / equity note) — EDGAR 10‑Q URL. - Diluted weighted‑average shares (EPS): EPS table (three months ended Mar 31, 2026) — EDGAR 10‑Q. - Cash and cash equivalents & Restricted cash: Consolidated Balance Sheets (cash lines). - Long‑term debt / Senior notes / Revolver: Note 2 Long‑Term Debt. - Finance lease obligations and operating lease liabilities: Leases note & Net‑Debt reconciliation. - Preferred Stock / Noncontrolling interest: Consolidated Balance Sheets (note preferred none issued). - Filing metadata: EDGAR accession number, filing date/time, period of report. - Latest price: IR stock‑quote widget or professional market API (record provider, quote, timestamp, and delay). Store URLs and exact table/line labels so future scrapers can re‑pull the same cell.
Ready‑to‑use table template editors can paste into an article
Suggested table columns (publishable, minimal required cells): - Field name | Numeric value | Units | Source (URL) | Filing date / Quote timestamp. Rows to include: Ticker & exchange; Share price (value + timestamp); Shares outstanding (date of count); Market capitalization (formula cell); Cash & cash equivalents; Restricted cash (if used); Total debt (breakout: senior notes, revolver); Finance lease obligations; Operating lease liabilities (optional); Net debt (company reconciliation); Enterprise value (formula cell with stated adjustments). Example cells to prefill from Mar 31, 2026 sources: Shares outstanding = 30,728,333 (10‑Q Apr 27, 2026); Cash & cash equivalents = $11,229,000 (10‑Q); Total debt = $175,000,000 (10‑Q); Finance lease obligations = $10,600,000 (10‑Q). Include a visible caption: "All figures and sources dated; market price may be delayed." Link each source cell to the EDGAR or IR URL.
Image and visual suggestions for the article
Use: 1) Small company header: Marcus Corporation logo (from corporate media kit) + NYSE:MCS label (captioned with rights/source). 2) Infographic: two‑box comparison 'Market capitalization vs Enterprise value' with the EV formula and the exact Marcus numbers used. 3) Data snapshot image: the table template rendered as a clean PNG with source URLs visible. 4) Timeline/scrubber: mini chart of share price (30‑day) from a reliable provider (IEX/Google/Nasdaq) with a time‑stamp and provider credit. Always verify logo usage rights and include alt text that states image date/timestamp and source.
Marcus East Net Worth: Estimate, Sources, and Key Milestones
Estimate of Marcus East net worth with source-based range, career milestones, wealth drivers, and accuracy limits.